
Observability overview
Gateway observes control-plane state, node health, workload health, ingress behavior, database health, build activity, inference usage, and security events.
There is no single all-purpose Observability screen. This page describes the operating model across the Dashboard and the detail views for Nodes, Routes, workloads, databases, builds, Tasks, notifications, audit, and status pages. A technical lead should use those signals to answer three questions: are customers affected, which owner must act, and how will recovery be verified?
The desired outcome is not maximum telemetry volume. It is a small set of trustworthy signals with named owners, useful retention, and a tested path from detection to customer-facing recovery. Gateway supplies product and infrastructure signals; service owners still define business-level success, service-level objectives (SLOs), escalation policy, and external dependency monitoring.
Use resource health for immediate state, metrics for trends, logs for diagnosis, durable Tasks for operation progress, notifications for action, status pages for customer communication, audit for attribution, and SIEM for external security analysis.
Design alerts around sustained customer impact and meaningful state transitions. Avoid duplicating every low-level event into a notification channel.
Define ownership and success
Section titled “Define ownership and success”For each important service, name the business owner, technical owner, on-call destination, and customer communication owner. Define what available means from the user’s point of view, not only from an internal process badge. A Route may be healthy while its application or database returns unusable responses; a Node may be online while one customer journey is broken.
Use an SLO—a measurable reliability target over time—to decide which conditions deserve alerts and which belong only in dashboards or reports. Record the expected recovery check in the alert itself. Success is reached when the customer path works again, the signal has recovered, and any temporary mitigation has been removed.
Signal types
Section titled “Signal types”| Signal | Best use | Common mistake |
|---|---|---|
| Health | Current service readiness | Treating one green badge as proof of end-to-end availability |
| Metrics | Capacity and trends | Alerting on every short-lived spike |
| Logs | Detailed diagnosis | Sending secrets or unbounded payloads |
| Tasks | Durable operation progress | Assuming an accepted task already completed |
| Events | Resource state transitions | Using event volume as a health metric |
| Audit | Who changed what | Replacing operational logs with audit records |
| Notifications | Operator action | Forwarding every informational event |
| Status pages | Customer communication | Publishing private topology or raw errors |
Build an operating view
Section titled “Build an operating view”- Start from customer-facing Routes and business services.
- Map each service to its ingress, workload, database, storage, and external dependencies.
- Define the health signal and SLO that represent customer impact.
- Add resource-capacity alerts with sustained windows.
- Route urgent events to an owned notification destination.
- Create a public status component only for information customers should see.
- Test failure and recovery, not only notification delivery.
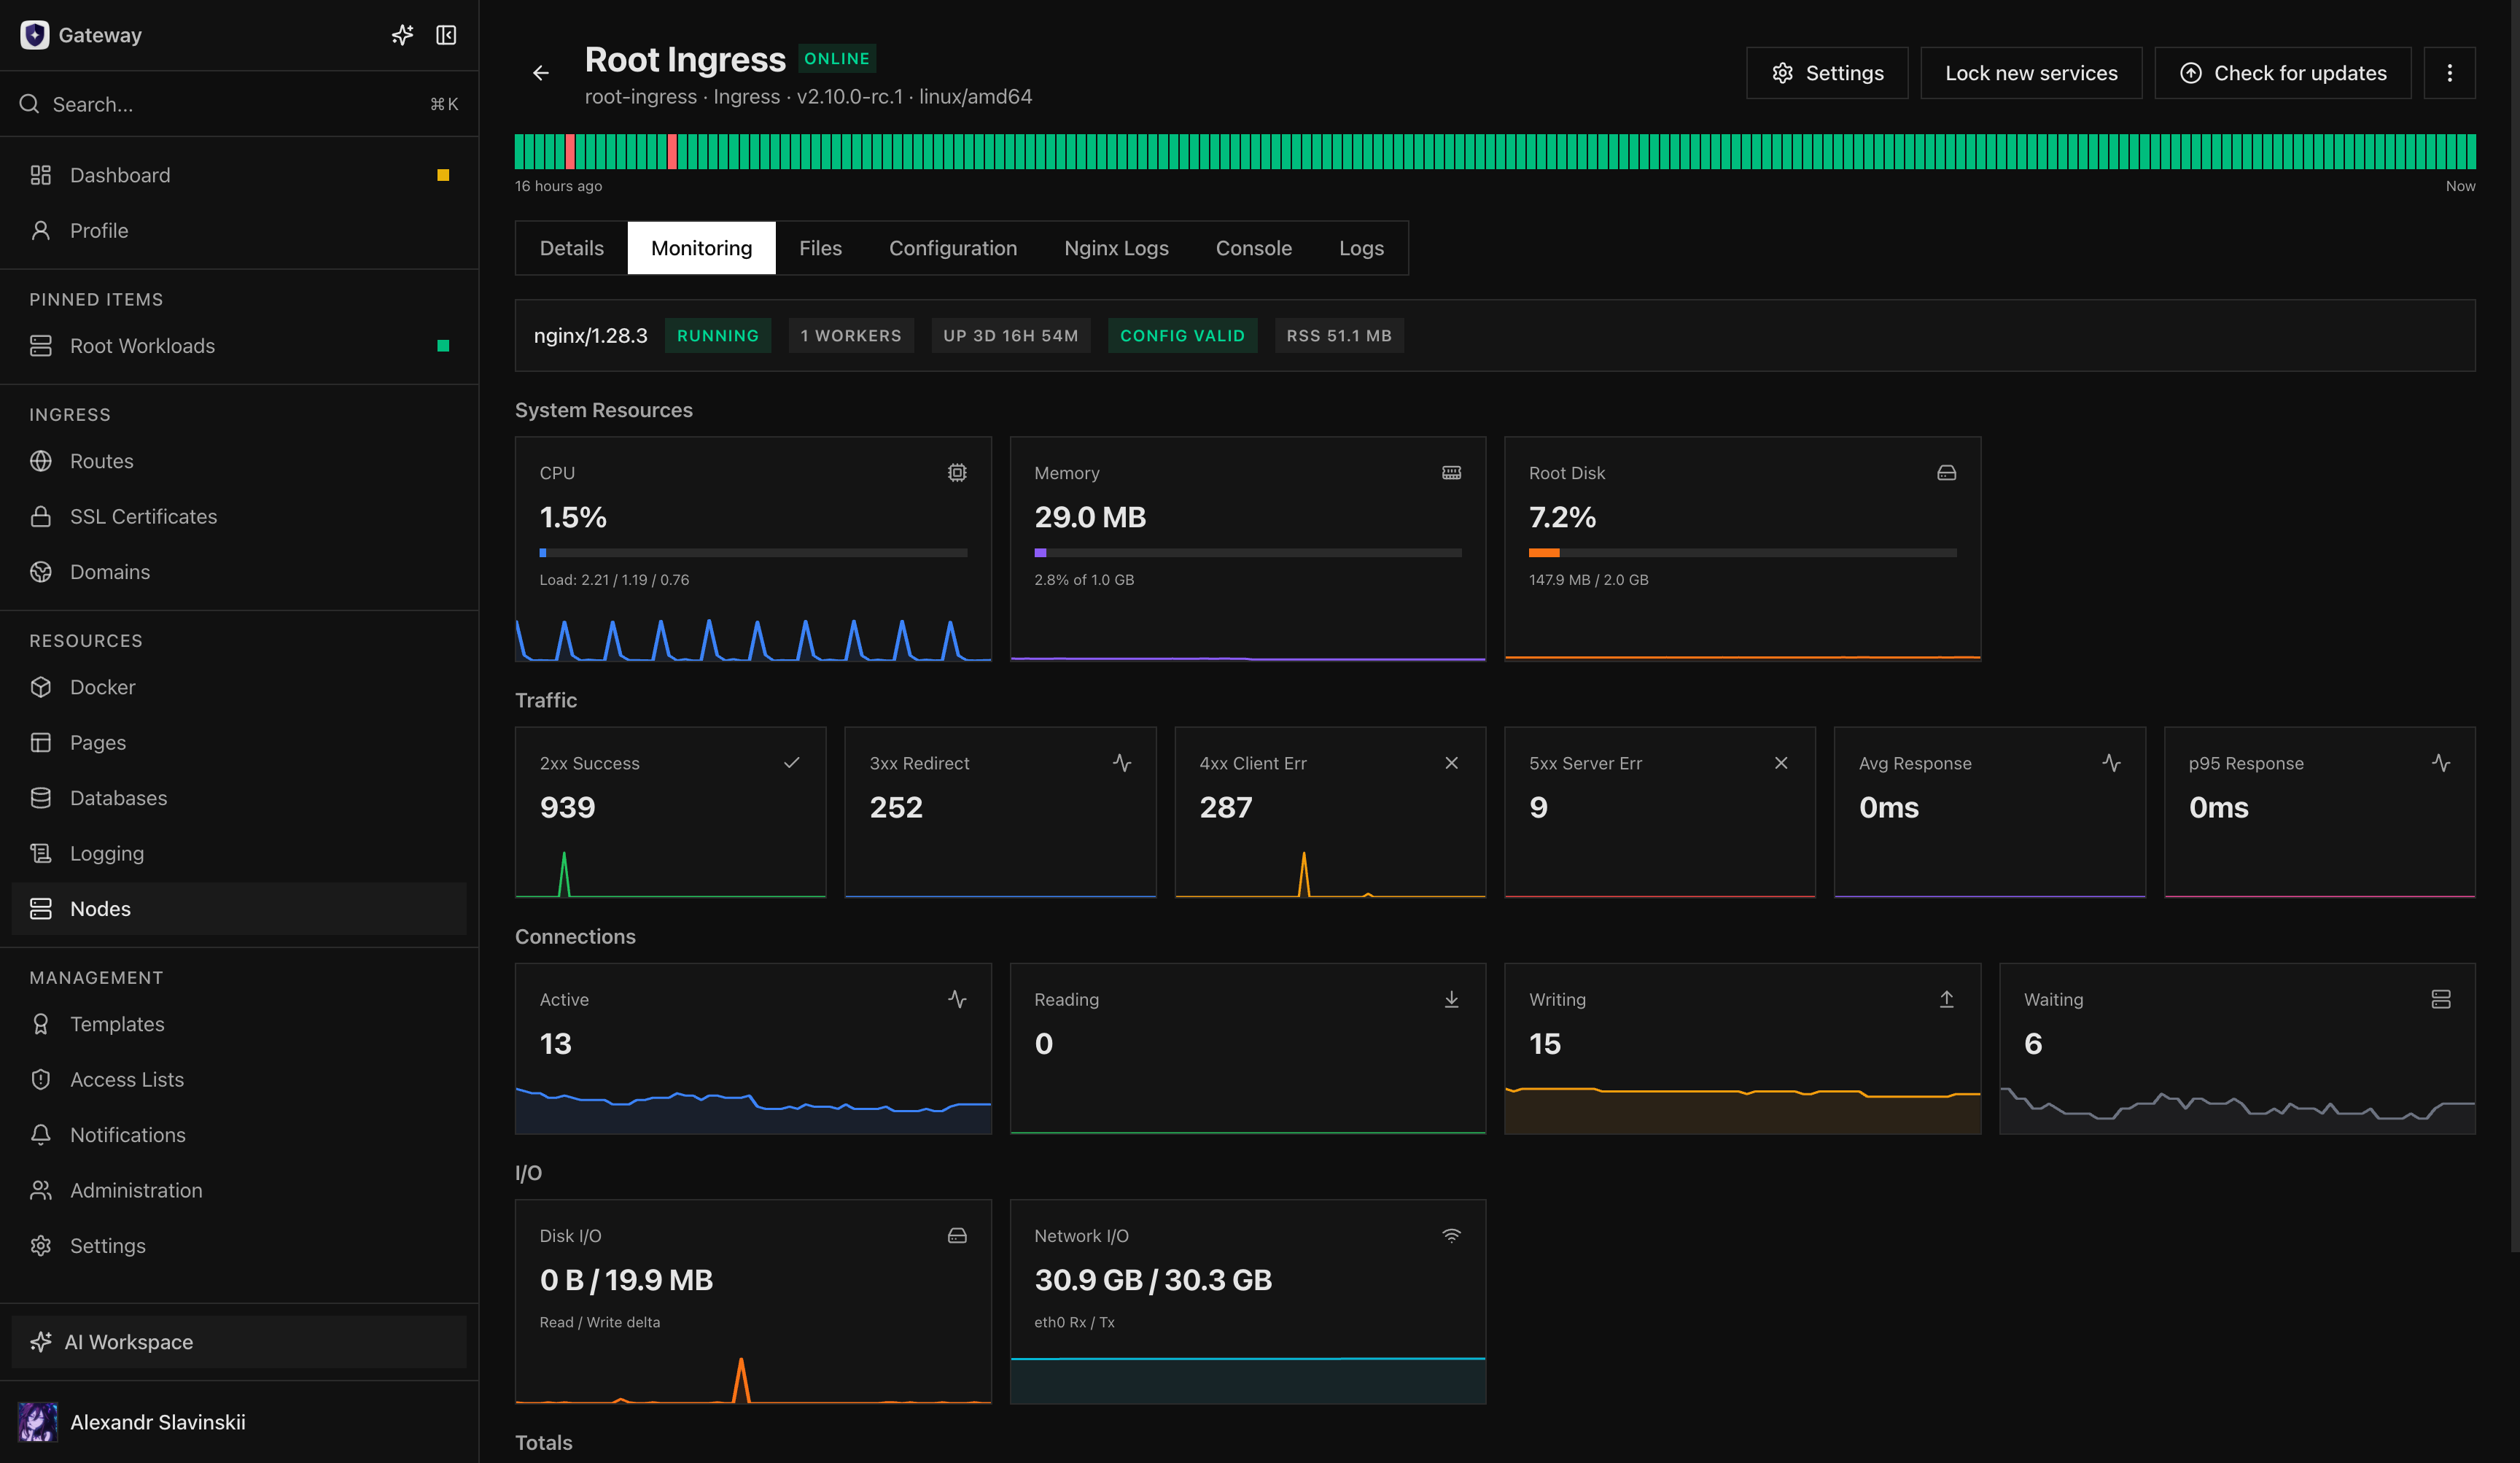
Diagnosis workflow
Section titled “Diagnosis workflow”Use the Dashboard for triage, then open the affected resource. Compare live health with recent metrics, Tasks, events, and logs. Correlate by stable resource ID, operation ID, request ID, and timestamp. If the displayed state is based on a cached snapshot, restore the owning Node connection before mutating the resource.
For database monitoring, collection starts in the background after Gateway bootstrap and when a managed database becomes ready; opening the database page is not a prerequisite. A first page visit may briefly wait for history or the first real snapshot, but it must not manufacture a healthy state from absent data.
During an incident, begin with the affected customer journey and move inward: public DNS and TLS, Route and Ingress, workload, private dependencies, storage, and external services. Use Tasks to distinguish an operation that was accepted from one that completed. Use audit to understand configuration changes, not as a substitute for runtime logs.
Verify observability itself
Section titled “Verify observability itself”Monitor the monitoring path: node freshness, ClickHouse health, notification queue delivery, status-page publication, SIEM outbox age, and storage retention. An observability system that silently stops collecting must generate a separate platform warning.
Keep telemetry long enough for incident reconstruction, but apply explicit retention and size budgets. Do not use logs as an uncontrolled data archive.
Operator details: stale and conflicting signals
Section titled “Operator details: stale and conflicting signals”Every health decision has a timestamp and an owner. If a Node disconnects, its last snapshot can become stale; restore the owning Node before mutating resources based on old information. If the sidebar warning and a detail page disagree, compare their source, timestamp, and aggregation rule rather than assuming either color is authoritative.
Treat missing data as unknown, not healthy. Verify that collection is progressing, the newest sample advances, ClickHouse is available where structured logs are expected, notification queues drain, and public status updates publish. After repair, run the original end-to-end check and document any blind spot that delayed detection.